US Census figures way off for Somali population in the US?

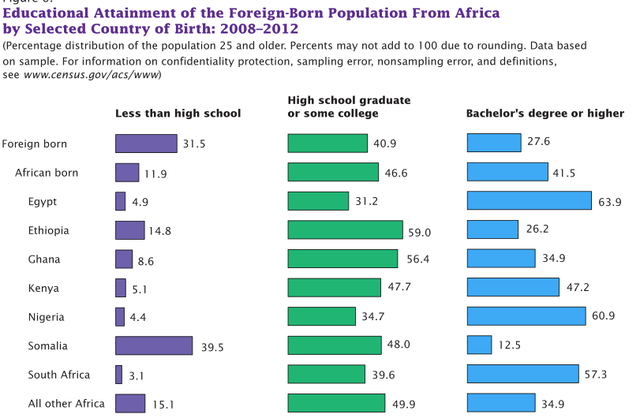
A comment on one of those discussion boards just caught my eye—the statement was that Somalis are the least educated of the African immigrants living in America.  I laughed out loud when I considered how clever they are at schemes to benefit themselves—like the housing voucher scheme in Cheyenne I just wrote about.  Who needs a formal education when you know how to make it without working too hard.

The discussion thread led to this story about the US Census Bureau report from early October about the African population in America which included this graph:


I went to have a look at the Census report and followed a link to this information: The Census Bureau says that 76,205 Somali immigrants live in America.  See Report and Supplemental tables here.

However, we have documented almost 120,000 admitted in the Refugee Resettlement Program alone, click here for that data. Our data doesn’t include all those who are here through other legal immigration programs or those who have entered illegally.

LOL! We know a bunch have left the country to join jihadists but not enough to account for that great a difference.

So, why the discrepancy?  Did the Census Bureau not find about 45,000 or more of them?

What does the refugee resettlement program cost US taxpayers?

A minimum of $1 billion but closer to $10 billion annually?

That is a question we get all the time!  But, honestly no one knows for sure because although the Office of Refugee Resettlement does a survey of a small number of refugees every year (for its always-late annual report to Congress) to see what services refugees access, they have really no idea.

Yesterday a reader (thanks Linda) sent me the Report to Congress for FY2015 that accompanies the Presidential Determination for how many refugees we are bringing in the new fiscal year.  FY2015 began on October 1st.  I hadn’t seen this year’s report, but it is a treasure trove of information which we will be bringing to your attention as time goes on.

This report is not to be confused with Annual Reports to Congress which look back at previous years.

Here is the FY2015 Report to Congress.  Note that the dollar figures we have here do not include:  costs associated with the Unaccompanied Alien Children’s Program, Temporary Assistance for Needy Families (TANF), Medicaid, Supplemental Security Income programs, the Victims of Domestic Trafficking, food stamps, public housing, WIC, education for the children, costs associated with the criminal justice system, interpreters, etc.

Remember Eskinder Negash told us here that the Office of Refugee Resettlement took care of 143,000 ‘refugees’ in FY 2013 (but some were UACs and victims of trafficking).

So, without those costs added in we are paying over $1 billion a year in tax dollars to resettle just over 100,000 refugees and asylees in one year.  Some experts say the cost for the “services” listed above for years (because we don’t just give welfare for the first year in America) would run the tab up to the $5-$10 billion mark each year.

Here, at nearly the last page of the FY2015 report, is the expected cost of resettling roughly just over 100,000 refugees and asylees this year—just to get them in and initially settled.  (Often readers are confused about which agencies are directly involved in the resettlement process.  You can see here it is Homeland Security, US State Department and the US Dept. of Health and Human Services (ORR).)

Table VII

Estimated Available Funding for Refugee Processing, Movement, and Resettlement
FY 2014 and FY 2015 ($ Millions)


Agency

Estimated
FY 2014
(by Department)

Estimated
FY 2015
(by Department)

Department of Homeland Security
United States Citizenship and Immigration Services
Refugee Processing 1

$32.3

$32.9

Department of State
Bureau of Population, Refugees, and Migration
Refugee Admissions 2, 3

$494.4

$ 418.0

Department of Health and Human Services
Administration for Children and Families,
Office of Refugee Resettlement
Refugee Resettlement 4

$616.3

$608.1

TOTAL $1,143.0 $1,059.0

The estimated FY 2015 figures above reflect the President’s FY 2015 Budget request and do not include carryover funds from FY 2014.

1 FY 2015: Includes cost factors to reflect Headquarters facilities rent related to the refugee resettlement program, projected staffing enhancements, and following-to-join refugee processing, in addition to certain ICASS costs.

2 FY 2014: Includes FY 2014 MRA appropriation of $351 million, $68.8 million in PRM carryover from FY 2013, $68.6 million projected IOM loan collections/carryover, and an estimate of $6 million in prior year MRA recoveries. A portion of these funds will be carried forward into FY 2015.

3 FY 2015: Includes FY 2015 MRA budget request of $360 million, $52 million in projected IOM loan collections/carryover, and an estimate of $6 million in prior year MRA recoveries. Funds carried forward from FY 2014 will also be available in FY 2015. [IOM loans are travel loans to refugees which when repaid partially return to resettlement contractors and not to the federal treasury—ed]

4 FY 2014 and FY 2015: HHS’s Office of Refugee Resettlement’s (ORR) refugee benefits and services are also provided to asylees, Cuban and Haitian entrants, certain Amerasians from Vietnam, victims of a severe form of trafficking who have received certification or eligibility letters from ORR, and certain family members who are accompanying or following to join victims of severe forms of trafficking, and some victims of torture, as well as Iraqi and Afghan Special Immigrants and their spouses and unmarried children under the age of 21. None of these additional groups is included in the refugee admissions ceiling except Amerasians. This category does not include costs associated with the Unaccompanied Alien Children’s Program, Temporary Assistance for Needy Families (TANF), Medicaid, Supplemental Security Income programs, or the Victims of Domestic Trafficking. The estimated FY 2015 figures above reflect the President’s FY 2015 Budget request and do not include carryover funds from FY 2014, as HHS does not anticipate any carryover funding from FY 2014.
Top ten languages spoken by refugees to America in last seven fiscal years; Arabic is #1

Fiscal year 2014 just ended on September 30th, so this is a good time to visit the Refugee Processing Center where statistics are managed for the US State Department. Shortly the 2014 year-end stats will disappear down a black hole, so visit Admissions and Arrival reports now! (FY2015 stats for the first month of this new fiscal year will appear shortly after the end of October.)

Just a reminder that it will be your local government and state that will be responsible for providing (paying for!) interpreters in schools, health departments and the criminal justice system as these refugees are resettled in your towns and cities.

Here are the top languages spoken by refugees who arrived in the US in FY2008 – FY2014 (and be sure to note the number speaking ‘minor’ languages):

1 Arabic 91,040

2 Nepali 78,862

3 Sgaw Karen 36,419

4 Somali 34,632

5 Spanish 27,814

6 Chaldean 15,694

7 Burmese 12,248

8 Armenian 12,066

9 Kayah 10,384

10 Other Minor Languages 9,448

Total 328,607

By the way, the US State Department’s Refugee Processing Center previously provided a lot of other very useful information—like what cities refugees were resettled in—which is no longer available to the public.  One more effort to keep this program as secret as they can possibly make it.

Taxpayers fund savings accounts for refugees

How do refugees get money for cars, houses, education, businesses?

The program is known as Individual Development Accounts through the Office of Refugee Resettlement (HHS).

Albert Mbanfu, Director of the International Center in Bowling Green, Kentucky. http://www.bgdailynews.com/new-international-center-director/image_02fb9de4-89e7-5d6d-97e8-6cf648b73901.html?mode=jqm

This is one of the many ways your local refugee resettlement contractor is able to hand out government (your) cash to refugees and surely get a little cash for themselves for administering the program.  (There are also micro-enterprise loan programs especially for refugees as well).

The local contractor gets a grant from ORR and then refugees may sign up for the savings plan.

For every dollar they save toward certain savings goals, they are matched with a dollar from the US Treasury.  Frankly the complete unfairness of the program to American low income people is often responsible for the hard feelings toward some refugees in certain areas.

We have heard disgruntled citizens ask, for example:  how are they getting cars?

We have reported on this program often but the story we mentioned from Kentucky (yesterday) contained a reference to the program that you may not have noticed, so I thought some clarification was needed.

Here is the section of the ‘Refugees get new homes’ Bowling Green article (hat tip: Robin) that I want you to see:

When Me Meh and her family escaped Burma for a refugee camp in Thailand, they lived in a bamboo house without electricity or other amenities.

The family of 10 resettled in Bowling Green in 2009, bringing with them only some clothes and important papers, Meh said. She was 17. Meh’s two older brothers and her father started work while she went to school and her mother took care of their home.

After a couple of years, the three had saved $4,000. She said the International Center gave them a grant that matched their savings, and they were able to put a downpayment on a house.

The reader is left with the impression that this very nice resettlement contractor—the International Center—was being generous, but this is taxpayer money that was only passed-through the contractor’s coffers!

Go here for a recent list of grantees for the multi-million dollar program.  And, for more information you might want to look at page 38-40 of the FY2012 Annual Report to Congress.   While you are visiting the Annual Report, check out all of the other grant programs that refugee contractors can apply for.  You will be amazed!

Addendum:  I was once told by an official involved with the refugee program in Washington that there is no financial audit done of these resettlement contractors.

Fiscal year 2014 wrap-up: Top nationalities admitted to US; top resettlement states

If you are following the refugee resettlement program closely you should occasionally visit the Refugee Processing Center for the data the US State Department is willing to allow the public to see.

They have taken away from public view one data table that we previously found interesting and that was the information on which nationalities were resettled in which city.  That was very useful and they surely still track those numbers but are only available to special people who have a pass code to get in.  Likewise they track the religions of refugees but again only friends of the refugee program are allowed to see those.

Before I get to those useful tables that you can still access, I noticed one more way to keep you in the dark.  One table that you might think would be useful and which I initially directed readers to in my previous post (removed now) is one in which it lists which refugees went to which state, BUT, on closer examination, it is useless!  Why?  Because it only shows the processing country and the US state to which the refugee was resettled.  Processing countries are virtually meaningless!

We don’t process refugees directly from Somalia yet we took in 9,000 Somalis in FY 2014 from all over the world apparently.  If you do look at that data table, check out Minnesota to see what I mean—they list no Somalis going to MN last year (2014), but we know they did (see data table from Minnesota listing 977 Somalis arriving there as of August 31), we just don’t know how many were processed in Kenya, in Malta, in Thailand etc.

Political caucus in Minneapolis (men sit on one side, the women on the other). https://refugeeresettlementwatch.org/2014/09/07/wnd-more-on-minnesota-somalis-welfare-and-jihad/ Photo: Star Tribune

Go here for all the data tables available to the public, some updated for September 30th, and some, as of this writing, only updated to August 31.  Don’t delay because these soon disappear down a black hole.

Somalis move up to the number three slot for the most number of refugees we resettled in FY2014. 

(See all of the numbers for Somali resettlement we have compiled over the last 30 years, here).

Top five nationalities of refugees resettled in US in FY 2014 (from this map):

1)  Iraq (19,769) the largest percentage will be Muslim

2)  Burma (14,598)  most will be Christians, other minority religions and some Muslims (update: a larger number than I originally assumed)

3)  Somalia (9,000) Muslims  (almost up to George Bush levels!)

4)  Bhutan/Nepal (8,434) most will be Hindu, Buddhist, a few Christians

5)  D.R. Congo (4,540) mostly Christians (update: some Muslims among them)

Remember we learned the other day that the Bhutan resettlement would soon end and be replaced by Syrian refugees who will be majority Muslim.

Top ten states receiving refugees in FY 2014 (I took these off the map so check it for me!):

1)  Texas (7,211)

2)  California (6,110)

3)  New York (4,079)

4)  Michigan (4,000)

5)  Florida (3,519)

6)  Arizona (2,963)

7)  Ohio (2,812)

8)  Pennsylvania (2,743)

9)  Georgia (2,693)

10)  Illinois (2,578)

North Carolina and Washington state are not far behind.

We have archived this information in two categories here at RRW:  Refugee Statistics and Where to find information.

Just a reminder to states (like Wyoming!) and cities which will “welcome” refugees in FY2015, you will not get refugees just from certain countries, but will get a smattering from a wide variety of countries which will make it even more difficult to deal with the language problems in the schools, the health department and the criminal justice system.   See the language stats by going here and clicking on ‘top ten languages.’