Fun with numbers! How many Syrian refugees have come to the US in FY2015 so far?

Once again readers pushed this post through the roof yesterday (What! you were spending your holiday reading about Syrian refugees coming to your cities?).

Recently I came across this very cool data base maintained at the Refugee Processing Center (a US State Department data collection center).   I just tried it for Syrian refugees who entered the US from October 1, 2014 to December 31, 2014 (that is three months of the fiscal year that ends September 30th, 2015).

The number is still small (164) so if the State Department plans to get to 9,000-10,000 (mostly Muslims by the way) by September 30th, they will soon be opening the spigot pretty wide.  Also, it is possible that all December arrivals are not yet entered in the data base.

Right now the top three states “welcoming” Syrian refugees are Texas, North Carolina (they are really working hard to transform NC!), and Illinois.

Here are the numbers (just refugees, not asylum seekers or any others who found another way into the US):

California:

Oakland (4)

San Diego (1)

Florida:

Jacksonville (6)

Georgia:

Atlanta (3)

Idaho:

Boise (8)

Illinois:

Chicago (14)

Wheaton (3)

Indiana:

Indianapolis (12)

Maryland:

Baltimore (7)

Massachusetts:

Beverly (2)

West Springfield (6)

Worcester (1)

Michigan:

Ann Arbor (4)

New Jersey:

Elizabeth (5)

New Mexico:

Albuquerque (6)

North Carolina:

Greensboro (10)

High Point (8)

Pennsylvania:

Erie (7)

Harrisburg (6)

Tennessee:

Memphis (4)

Nashville (1)

Texas:

Austin (1)

Dallas (5)

Houston (7)

Utah:

Salt Lake City (5)

Washington:

Seattle (5)

Spokane (7)

Go to the data base now and have some fun!  Check out nationalities who came to your city over a given time period.  The data is available back to 2002.

Endnote: I hope those single Syrians arriving in some cities aren’t single young men!

Iraqis top list of refugees resettled in first 2 months of fiscal year; Texas top resettlement state

Two months of fiscal year 2015 are now behind us and the US State Department and its contractors are off and running with a surprising number of refugees resettled so far.

These were the top 5 states in FY2014. Right now Arizona is edging out Florida and Michigan has moved to number 3.

According to the statistics kept at the Refugee Processing Center, Iraqis top the list.  Here are the Top Five countries of origin for refugees arriving in the US in October and November 2014 (the 2015 fiscal year began Oct. 1):

Iraqis:  3,367

Burmese:  2,530

Somalis:  1,856

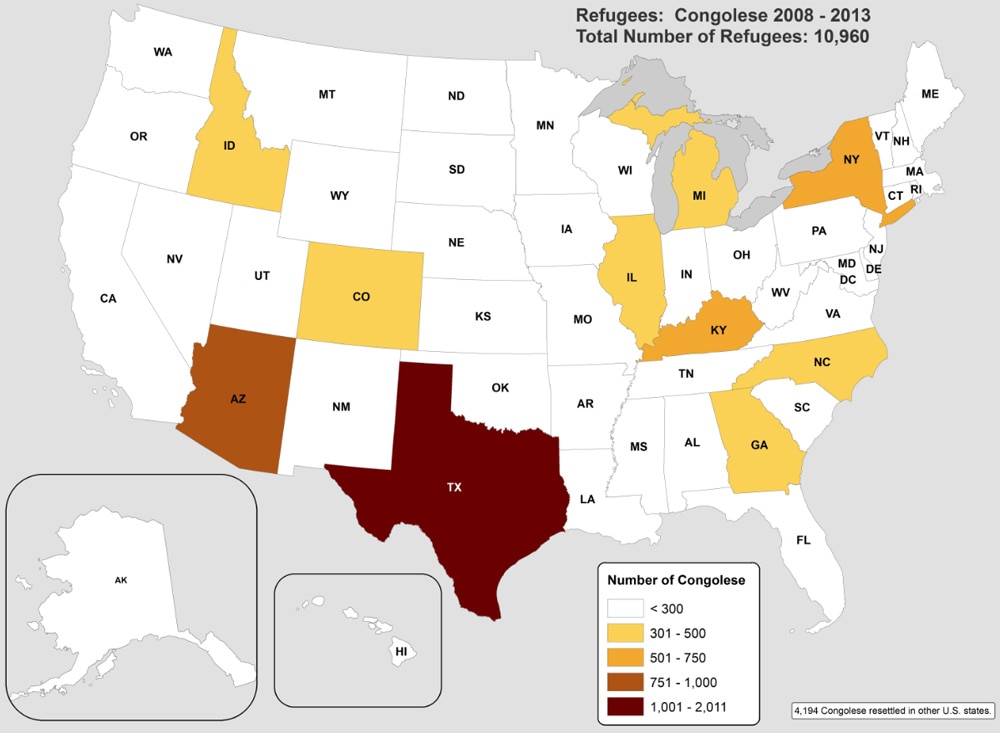
Congolese:  1,004

Bhutanese:  870

The Syrian push is not on yet we see. Only 112 have come so far this year.

We then checked out any state that received more than 400 refugees in two months (which is a lot when supplying them with their welfare needs), and here they are:

Texas:   1,386

California:  997

Michigan:  585

New York:  584

Arizona:  564

Florida:  530

Washington:  529

Ohio:  514

Illinois:  475

Minnesota:  435

Georgia: 435

North Carolina:  434

Pennsylvania:  433

If you are wondering which nationalities have arrived in your state, you are out of luck because the State Department has removed the data base that tells us that.  Instead they have a completely useless data base that only tells us the ‘processing country’ from which your state’s refugees arrived.

Well, maybe I shouldn’t call it completely useless because it does give us some bits of information to ponder. For example, we learn that we took another 116 of Malta’s illegal aliens off their hands (probably Somalis).   466 came to the US from South Africa (the safe Rainbow Nation country), so who were they?  I noticed a bunch (79) of those South African “refugees” went to Minnesota.

I was interested to see we processed 1,070 from Turkey and a whopping 1,504 from Malaysia (who were they, illegal aliens trying to reach Australia?).  And we helped out the United Arab Emirates by taking 45 “refugees” off their hands.

This post is archived in our “where to find information” category and our “refugee statistics” category.

CDC Health profiles released for Bhutanese and Congolese refugees in America

The Centers for Disease Control has some reports you might like to see if Bhutanese and/or Congolese refugees are being resettled in your towns.  This could be important information needed by your local health department.

Below is where you can find more information at the CDC website.

The CDC has some great stats, and not just on health issues. http://www.cdc.gov/immigrantrefugeehealth/profiles/congolese/population-movements/index.html

For the Bhutanese the big concerns are nutritional deficiencies, communicable diseases and mental health problems relating to their ability to adjust to living here. (We have already brought over 70,000 Bhutanese/Nepalese to the US).

For the Congolese (we have begun the movement of 50,000 to the US) the big concerns are parasites, Malaria, and mental health problems relating to sexual and gender-based violence.

Gee, I guess Obamacare’s money tree will be taking care of all these problems!   (This post is archived in our ‘health issues’ category).

CDC:

The refugee health profiles found on this page provide key health and cultural information for specific refugee groups resettling to the United States. Information gathered from the World Health Organization (WHO), International Organization for Migration (IOM), the Office of the United Nations High Commissioner for Refugees (UNHCR), US Department of State, and other sources is provided to help resettlement agencies, clinicians, and public health providers facilitate medical screening and interventions appropriate for each refugee group.

Each profile has six components:

  • priority health conditions
  • background
  • population movements
  • health care and nutrition in camps/urban settings
  • medical screening of US-bound refugees
  • health information

Available refugee health profiles include:

First month of FY2015, Iraqis top the list of refugees resettled by US State Department

The Refugee Processing Center is the keeper of the US State Department’s statistics on refugees arriving in the US. I am asked all the time, do they keep records of religions, and the answer is yes, but those stats are not available to the general public. Only special people have that access. http://www.wrapsnet.org/

October 31st marked the end of the first month of Fiscal Year 2015.  You can have a look at which refugees the US State Department has admitted in those 31 days by clicking here.

Topping the list is Iraq with 1,790 Iraqis going to your towns and cities.

The next five after Iraq are as follows:

Burma:  1,240

Somalia:  871

DR Congo:  625

Bhutan:  370

Iran:  309

And, so far 51 Syrians entered the US in this fiscal year.

By the way, do you see the table listed here entitled: Arrivals by State and Country (Posted after the 5th of the following month).  It is virtually useless to you because the refugees’ nationalities are not given, only the processing country.  So if you look at Minnesota for instance, you can be sure MN got some of those Somalis, but Somalia isn’t listed.  Much to my surprise South Africa is listed! 

WTH, surely we aren’t bringing persecuted white South Africans, but I will bet you a buck we are bringing some of the unwanted Somalis from the RAINBOW NATION!  48 went to Minnesota in just the last month!  So much for South Africa’s image as a welcoming country!

Just one more example of how the State Department keeps information from the general public:  there previously was a data table available for which refugees went to which CITIES, but that is no longer listed as available to you (or me).  You can be sure they have that information!

Remember Obama is shooting for 70,000 total refugees for the year, but dissatisfied resettlement contractors, like the Hebrew Immigrant Aid Society, are looking for 100,000.

US Census figures way off for Somali population in the US?

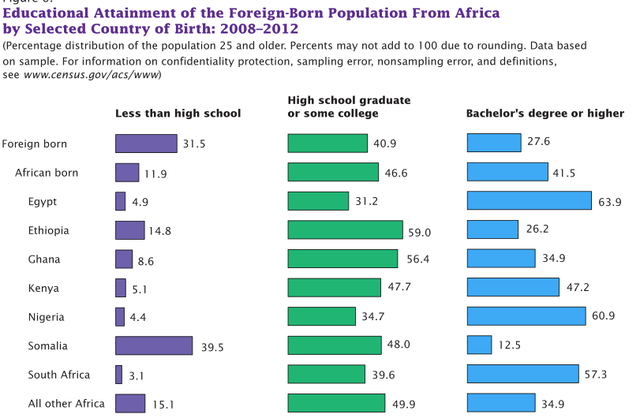
A comment on one of those discussion boards just caught my eye—the statement was that Somalis are the least educated of the African immigrants living in America.  I laughed out loud when I considered how clever they are at schemes to benefit themselves—like the housing voucher scheme in Cheyenne I just wrote about.  Who needs a formal education when you know how to make it without working too hard.

The discussion thread led to this story about the US Census Bureau report from early October about the African population in America which included this graph:


I went to have a look at the Census report and followed a link to this information: The Census Bureau says that 76,205 Somali immigrants live in America.  See Report and Supplemental tables here.

However, we have documented almost 120,000 admitted in the Refugee Resettlement Program alone, click here for that data. Our data doesn’t include all those who are here through other legal immigration programs or those who have entered illegally.

LOL! We know a bunch have left the country to join jihadists but not enough to account for that great a difference.

So, why the discrepancy?  Did the Census Bureau not find about 45,000 or more of them?