As you know by now the President’s cap for refugee admissions for FY2020 is 18,000 and you also should know that none arrived in October (the first month of the fiscal year) because President Trump had waited a month to sign the order.
Well, here they come! Who are they? And where did they go?
The International Organization for Migration (IOM), a branch of the United Nations that takes care of doling out the plane tickets American taxpayers pay for, is reporting 600 in the first wave.
IOM Welcomes First US Bound Refugees Resettled in FY 2020
Washington DC – More than 600 refugees landed in the United States this week, marking the first arrivals of US fiscal year 2020. The International Organization for Migration (IOM) welcomed the refugees who come from a variety of countries.
[….]
IOM works closely with the US Department of State’s Bureau of Population, Refugees and Migration to provide case processing support, pre-departure health assessments and cultural orientation, as well as transportation support for refugees.
Congolese senior citizens, new Americans, get instructions on how to get their benefits. https://fraudscrookscriminals.com/2019/03/08/kentucky-refugee-seniors-going-hungry-as-us-imports-more-poverty/
A group of 25 Congolese refugees were the first to arrive on Tuesday morning at Washington Dulles International Airport before continuing to their final destinations. Due to ongoing violence, the families fled to neighbouring Rwanda where they remained in limbo for years. [And, remind me why this is our problem!—-ed]
Almost half of the refugees resettled in the US in fiscal year 2019 were from the Democratic Republic of the Congo. Several others arriving this week are also Congolese.
What is so maddening about the Congolese wholesale movement to America is that Obama told the UN in 2013 that we would take 50,000 over five years and we are now almost at 60,000 and they are still coming.
I bet the deep staters at the US State Department never told the Trump people there was supposed to be a limit on the Congolese!
So it is no surprise that when I checked the data at the Refugee Processing Center I see that 226 of the 563 refugees admitted in the last week are DR Congolese!
I suspect the discrepancy in the numbers reported by IOM and the RPC is that IOM has shipped off 600 (maybe), but the State Dept. data base isn’t up to the minute and shows that we admitted 563 refugees from the first of November to today.
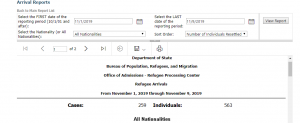
Because I don’t plan to report every month about who came and where they went, I’m going to give you a tutorial on finding out yourself!
Then click on ‘Interactive reporting’ (there are useful data in the other categories), but for today’s lesson it is ‘Interactive reporting’ that you want.
You will get a screen that looks like this:
For the first exercise I picked the first choice: MAP.
A screen opens that asks for your start date and the last date. I chose November 1 to today, the 9th. It asks for nationalities and provides a drop- down (I chose all) and I chose for sort order ‘number of individuals.’
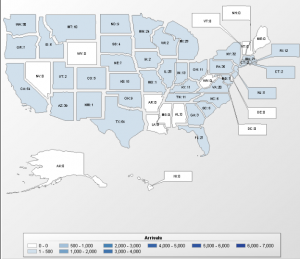
And presto, I got this map (below) to show where 563 refugees were placed between November 1 and today. On the page after the map I can see the numerical breakdown for all of the states that ‘welcomed’ refugees over the last week.
As usual Texas is numero uno!
(Reminder! These are just refugees admitted through the US Refugee Admissions Program, not unaccompanied alien children, not Special Immigrant Visa holders, and not asylum seekers!)
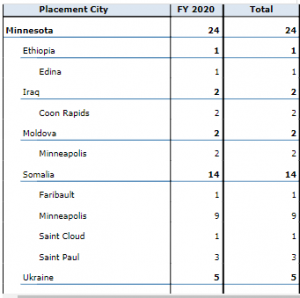
Now go back to the first screen and see your other choices for searches. You can find out which ethnic groups were placed in which cities in your state.
When choosing parameters for the ‘arrivals by destination’ search, choose ‘fiscal year’ and ‘destination.’ Just for fun I did Minnesota. Here are the ‘new Minnesotans’ that arrived this week.
You can find out the religions of refugees arriving (although not by state). And you can even find how many kids are coming (cost to your schools!) and how many senior citizens will be coming to collect their SSI.
I’ve never been able to find out which contractors settled which refugees. It might be there somewhere and if you find it let me know!
Here is what I did learn for the whole batch this week:
Of the 563 we brought in as ‘new Americans’ ….
226 are from the DR Congo
Moldova 56
Afghanistan 40
Ukraine 38
Syria 32
Burma 27
Liberia 26
Somalia 26
Eritrea 18
Iraq 18
Sudan 15
Plus smaller numbers from many other countries.
Of the 563, 154 (27%) belong to one or another Muslim sect. I was surprised to learn that a small number of the DR Congolese are Muslims. There is no Muslim ban!
Now you too can do this yourself and I recommend that you do it at least monthly and see who is coming to a town near you!
(Have fun, play around with it!)
For serious students of the refugee program, this post is filed in two categories here at RRW: ‘Where to find information’ and ‘Refugee statistics’. All categories are in a drop-down on the right hand side bar at RRW, here.
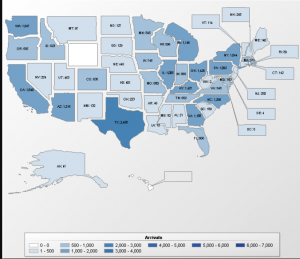
As many of you may recall, at this time last year the Trump Administration set the CEILING, for resettlement of refugees largely chosen by the UN for the fiscal year, at 30,000. And, that is exactly how many refugees were admitted and distributed to 48 states and the District of Columbia.
That 30,000 does not include the Special Immigrant Visas (SIV)from Iraq (181) and Afghanistan (7,501!) who entered the US this past fiscal year with all of the benefits refugees receive (welfare, food stamps, job counseling, housing, medical care and the list goes on!)
For the fiscal year that begins today, the President hasreduced the ceiling (or cap) to 18,000and by doing so has lit a firestorm in the refugee industry that includes Open Borders advocacy groups, federal resettlement contractors, and businesses which are freely admitting that they need the steady flow of cheap legal labor (labor that doesn’t complain and can’t readily leave!).
So from what countries did they originate and which states were the most ‘welcoming?’
The top five sending countries (FY19) in descending order are these:
DR Congo
Burma
Ukraine
Afghanistan (if you add the SIVs, Afghans would make up the second highest number of taxpayer supported ‘refugees’ for this year.)
Eritrea
Muslim refugees made up about 16% of the 30,000. However, virtually all of the SIVs are Muslims so that would push the percentage of arriving ‘refugees’ who are Muslims to 33%. No Muslim ban!
Here is a map showing where the 30,000 were placed. There is a spread sheet detailing where the SIVs were placed, but it isn’t in this handy format.
I know the numbers are difficult to read so here are the top ten ‘welcoming’ states for FY19:
Texas
Washington
New York
California
Kentucky
Ohio
North Carolina
Arizona
Georgia
Michigan
Teddy and Uncle Joe were chief sponsors of the Refugee Act of 1980, yet Delaware, Biden’s home state, rarely gets any refugees. Hmmmmm!
Two states received no refugees.
Wyoming has never agreed to resettling refugees in the history of the program. And, then Hawaii rarely gets any.
Delaware got one refugee in FY19 and it also usually only gets a handful—a fact that has always made me laugh since their homeboy, Joe Biden, was one of Ted Kennedy’s sidekicks when the program was created in 1979/80. (Ha! And, don’t say it is because the state is geographically small, RI is smaller than Delaware and it usually gets a bundle!).
West Virginia got 2 refugees, and the District of Columbia got a whopping total of 5 refugees!
I was looking for something else, and I’ll post it when I find it, but the Migration Policy Institute, last fall, published this useful information on MENA immigrants in America. Who knew that there was even a separate category for them.
Before you read on, just a reminder that the Migration Policy Institute is a pro-open-borders Leftie-funded (Soros et al) ‘think tank,’ (we wrote a lengthy post on them here in 2011), however, since the Left needs this data too (LOL! for voter outreach), I doubt they would mess with stats like these.
MPI says the top 5 states for MENAs are: California, New York, Michigan, Texas and New Jersey. It looks like Virginia and Florida are not far behind!
Political unrest and violent conflict have displaced millions in Syria and other parts of the Middle East and North Africa (MENA) since late 2010, generating significant international interest in immigrants and refugees from the region.
In the United States, the September 11, 2001 attacks and subsequent military intervention in Iraq in 2003 also drew heightened — and sometimes unwanted — attention to the highly diverse MENA immigrant populations in the country, many of whom are Muslim.Yet immigrants from the MENA region have a long history in the United States. As early as 1920, the country was home to at least 50,000 immigrants from the region, primarily from what was then Palestine and Syria, including present-day Lebanon. Their numbers have steadily grown over the past few decades, and in 2012, about 961,000 immigrants from the region resided in the United States, representing just above 2 percent of the nation’s 40.8 million immigrants.
Iraqis are the largest single-country immigrant population from this region, followed closely by Egyptians. The number of immigrants from Saudi Arabia and Yemen has also grown rapidly over the past decade.
[…..]
Compared to other immigrant groups, the foreign born from the MENA region are better educated and tend to have higher levels of English proficiency, but have comparatively lower rates of labor force participation. [So, are they living off the US taxpayer?—ed]
There are lots of links to follow for more information, here are just two bullet points I followed. If you have a feeling the speed of their arrival has increased, the answer is Yes!
Forty-five percent of foreign born from the MENA region in the United States arrived in 2000 or later.
In 2011, 45 percent of MENA foreign born had entered the country in 2000 or later, with 25 percent having arrived between 1990 and 1999, 15 percent between 1980 and 1989, and the remaining 16 percent prior to 1980.
MENA men and women don’t like to work!
Immigrant men and women from the MENA region were less likely to participate in the civilian labor force than were foreign-born men and women overall.
In 2011, foreign-born men ages 16 and older from the MENA region were less likely to participate in the civilian labor force (72 percent) than were all foreign-born men (78 percent). Foreign-born women from MENA countries were also less likely to participate in the labor force (42 percent) than were all immigrant women (57 percent).
Among men, Algerians (91 percent) and Sudanese (87 percent) had the highest labor force participation rates, while Iraqis (65 percent) and Saudis (23 percent) had the lowest labor force participation.
Consider that we resettled 19,491 Iraqis in the US in 2013, here, and are on target to admit a similar number this year, it sure looks like the US taxpayer is going to be supporting a large percentage of them. And, by the way, who the heck are all those (rich?) Saudis getting into the US, and through what legal program?
One of the stories on the Tennessee meetingthis week, linked this handy chart (click here) for you to see how many refugees and from what country came to your state in fiscal year 2012. The Obama Administration/feds and their contractors were shooting for 70,000 refugees last year but resettled 58,238.
Check the numbers here (Refugee Admissions Report as of Jul 31, 2013) at WRAPS (Refugee Processing Center) and note that again Obama wants 70,000 and they may come close to that for FY2013. As of July 31st they had resettled 57,030 with two months to go until the fiscal year ends on September 30th. (These numbers do not include asylees)
You should open some of the other data tables at WRAPS, they are very informative.
I often forget about it myself, but we have an entire category entitled “Where to find information” that you might find useful.
The list below represents the number of refugees resettled in your state from fiscal year 2007-2013. The stats are maintained by the US State Department at their Refugee Processing Center in Virginia. Here is the website, but its difficult sometimes to find the statistics easily. The list below was discovered by one of our many friends from Tennessee.
This is what the Refugee Processing Center says of its job (you’ve heard me mention WRAPS before):
The Refugee Processing Center (RPC) is operated by the U.S Department of State (DOS) Bureau of Population, Refugees, and Migration (PRM) in the Rosslyn section of Arlington, Virginia USA.
At the RPC and at Resettlement Service Centers (RSCs), an interactive computer system called the Worldwide Refugee Admissions Processing System (WRAPS) is used to process and track the movement of refugees from various countries around the world to the U.S. for resettlement under the U.S. Refugee Admissions Program (USRAP).
By the way, they keep statistics on the refugees’ religious affiliations, they just don’t make those public.
I think you will find this list as interesting as I do!
From 2007-2013 your state got this many refugees:
Wyoming 0
Montana 11
Puerto Rico 25
Hawaii 39
Delaware 49
Mississippi 51
West Virginia 81
Arkansas 83
District of Columbia 199
Alaska 522
South Carolina 812
Alabama 934
Rhode Island 1,057
New Mexico 1,112
Maine 1,294
Louisiana 1,563
Vermont 1,961
Kansas 2,007
North Dakota 2,620
Connecticut 2,817
New Hampshire 2,864
Nevada 2,945
South Dakota 2,986
Iowa 3,289
New Jersey 4,073
Wisconsin 4,095
Nebraska 4,593
Oregon 4,901
Idaho 5,924
Maryland 6,451
Utah 6,559
Tennessee 7,993
Indiana 8,536
Virginia 9,091
Kentucky 9,260
Massachusetts 9,386
Colorado 9,654
Ohio 11,508
Minnesota 12,112
North Carolina 13,977
Pennsylvania 14,365
Illinois 14,520
Oklahoma 14,901
Washington 15,300
Georgia 16,692
Arizona 18,415
Michigan 19,442
Florida 21,458
New York 24,139
Texas 40,257
California 48,813 Total: 399,179


 Where does your state rank?