CIS: US Remains Top Refugee Resettlement Country in the World; See Top US Cities

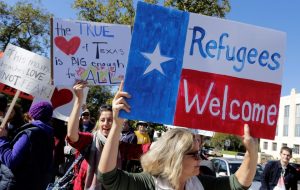
You would never know that if all you ever read is the mainstream media eager to show that Donald Trump’s America is mean while other western countries are ‘welcoming.’

From the Center for Immigration Studies:

And most likely will be in 2020, as well

New data released by the United Nations High Commissioner for Refugees (UNHCR) on its 2019 resettlement activities shows that the United States remains the top country for refugee resettlement. Furthermore, just like in previous years, the vast majority of refugees referred by UNHCR for resettlement in third countries in 2019 were not the most vulnerable or in urgent need of relocation. This contradicts the UN refugee agency’s constant claims that resettlement is a “life-saving tool”, a “critical lifeline” for refugees that needs strengthening. This also casts some doubt on UNHCR referral processes.

[….]

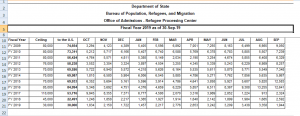
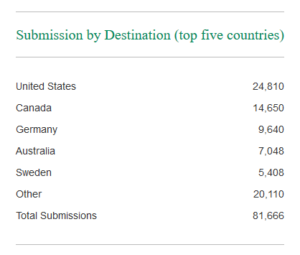
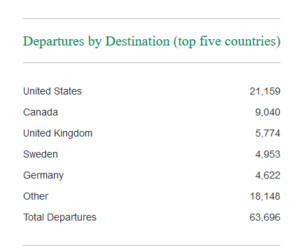
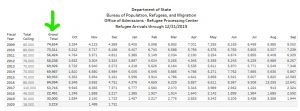
The statistical snapshot provided by UNHCR on its 2019 resettlement activities (figures are for the calendar year) has the United States as the top resettlement submission and destination country in 2019 (as it was in 2017 and 2018 under the Trump administration, see here and here):

Now see below which countries actually took in fewer by larger margins than the US.

Continue reading all of Nayla Rush’s detailed report.

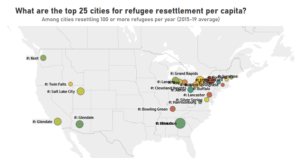
How are your cities doing?

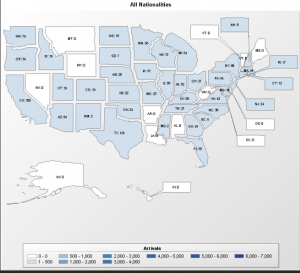
There is some very cool data on which US cities get the most refugees on a per capita basis here at American Public Media Research Lab.

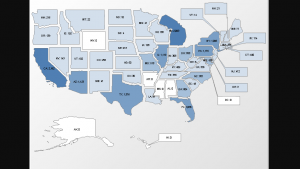
I chose the data for the Top 25 US cities ‘welcoming’ 100 or more refugees each year between 2015 and 2019.  The maps are interactive so when you visit you can click on the city and learn more details.

That smashed together location in Georgia is Atlanta and Clarkston. Clarkston is the number one city in the country on a per capita basis.


Since it is such a muddle there in the Northeast, here is a blow-up of that section of the map:

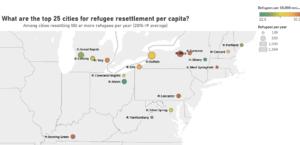
You might want to go visit and see if your city is in the Top 100.

Note to PayPal donors!  I want to thank all of you who send me donations for my work via PayPal. I very much appreciate your thoughtfulness. However, PayPal is making changes to their terms of service and I’ve decided to opt-out beginning on March 10, 2020.

Smallest Number of Refugees Entering the US in Last Ten Years

As you know President Donald Trump set the ceiling (as it is his right to do under the Refugee Act of 1980) at 18,000 for fiscal year 2020.

Four months into the year (the fiscal year began on October 1, 2019) we have admitted 4,686 refugees from leading sending countries of Afghanistan, Burma, DR Congo, Eritrea, Moldova and Ukraine.  Smaller numbers came from dozens of countries. About 918 of the 4,686 are Muslims.

Here is the big however—Special Immigrant Visa holders from Afghanistan numbered 4,585 in just the last four months bringing the total to 64,280 since 2006. And, those majority Muslim Afghans that supposedly helped us somehow in Afghanistan are given the same privileges as regular refugees. Iraqi SIVs numbered 129 (18,677 since 2006).

Before I get to the details of where they were all placed, don’t miss John Binder’s Friday Breitbart story where he provides the astronomical numbers of migrants coming into the US through myriad legal pathways from the President’s travel restricted countries.

See how many regular refugees were admitted to the US in the last ten years. Note that Obama didn’t set an extremely high ceiling until he was leaving office in 2016 and setting the ceiling for 2017.

Every time I see the deceivers in the media tout Obama’s 110,000 I want to scream at them to tell the whole truth! Don’t forget that the Dem candidates for President are talking 125,000 and up for their refugee importation plans.


Here is a map from the Refugee Processing Center for the first 4 months of this fiscal year.  I showed you how to find this kind of information yourself in Knowledge is Power IV.

You might want to compare this map of where new refugees are being placed right now with the map in my previous post which shows some states that don’t want any, or have not yet made a decision, but are definitely getting some.


The top five states ‘welcoming’ regular refugees (4,686) are Washington, California, Texas, New York and Minnesota.  Minnesota doesn’t usually rank this high.

The top five states that are unknowingly getting the Special Immigrant Visa holders from Afghanistan (4,585 nationally in the last 4 months) are California, Texas, Virginia, Washington, and Maryland.

Using my instructions I gave you in Knowledge is Power IV, you can find the towns and cities that host new refugees. For the SIVs you can find only the states by first going here and clicking on “Cumulative arrivals…” (or see below) to find how many went to your state.

Play with the data at the State Department’s Refugee Processing Center, it is fun (sort of) as a cold winter day project!

Cumulative Arrivals by State for Refugees and SIV Reception and Placement (R&P) Recipients – Afghan

Republican Governors All Talk No Action (Memory Lane!)

Do you remember this headline only four short years ago?  Probably not.  I hadn’t, although I surely wrote about it at the time.  It was right after one of those horrible Islamic terrorist attacks in Europe and it woke from slumber some Republican governors for a few minutes.

30 Governors Call For Halt To U.S. Resettlement Of Syrian Refugees

My how things have changed.

They talked tough then (mostly because Obama was in office and they knew they had no voice), but now when the President has actually presented them with an opportunity to put up or shut up and go on record saying NO to more refugees from the Middle East and elsewhere, well now they are worried about their “workforce” and they tuck their tails and run fearing they will be perceived as mean and unwelcoming by the Dems.

Here is a very cool graphic from NPR at the time.


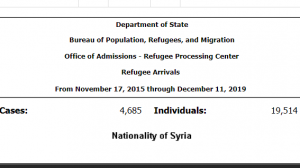
Nothing has changed by the way!  We bring fewer Syrians these days, but the vast majority of Syrians who do come are Muslims.

And, not just Syrians, but Iraqis, Somalis, Burmese Rohingya and literally tens of thousands of Afghans.

The vetting can’t really be improved because as Senator Marco Rubio said at the time:

“There is no background-check system in the world that allows us to find that out, because who do you call in Syria to background-check them?”

That same common sense applies to most places in the Middle East, Asia and Africa—who you gonna call?

Although I should be writing on all sorts of things on this subject, not to mention that my other blogFrauds and Crooks’ is suffering from lack of attention, I found myself rummaging around Wrapsnet (the Refugee Processing Center) and holy cow!

Four years: 19,514 Syrians!

In the 4 years since NPR posted their story (from November 17, 2015 to today December 11, 2019) we admitted 19,514 Syrians—19,514!  19,195 of those are Muslims!

Although most of those came as Obama was leaving town, 6,413 of the Syrian Muslims came in Trump’s first (partial) year with 602 since.

Here is where the nearly 20,000 Syrians were placed:

Amazing how we forget!  

Don’t miss Daniel Horowitz today at Conservative Review:

GOP governors betraying constituents by pushing refugee resettlement

He linked a list of today’s Republican Governors and so far that we know of (some might be hiding!), Republican governors of Utah, New Hampshire, Arizona and North Dakota are opposing the President (and America Firsters) on the issue of Refugee Resettlement.


In Fiscal Year 2020 Texas Continues as the Number One Refugee Resettlement State in Nation

Have you taken 15 minutes to make your calls?

Just so you know—most of the country ‘welcomed’ some refugees in the first group of arrivals for FY2020.

Resettlement will continue as it always has until June 2020 when supposedly the Trump EO will be in effect.

As Open Borders Inc. continues on its quest to turn Texas blue, Texas is again numero uno in ‘welcoming’ Africans, Asians and Middle Eastern impoverished refugees to its towns and cities.

If (when!) the contractors convince Texas Governor Abbott to send a permission letter to the US State Department, the contractors will achieve a great victory.  So, I sure hope you Texans are working hard!

Have you taken 15 minutes to make your calls?

(See previous post  Kansas has thrown in the towel! Taxpayers will pay the price just so some meatpackers will get cheap labor!).

Below is where the US State Department and its nine contractors*** placed 1,488 refugees in the last month.

Nothing I can do about the tiny type. I told you all here how to use the Refugee Processing Center data.

The top ten ‘welcoming’ states have a few additions.  I haven’t seen Indiana or Minnesota in the top ten in recent times, and Kentucky is climbing up the ladder.

Texas, California, New York, Kentucky, Arizona, Washington, Indiana, Illinois, Minnesota and Florida are the top ten in that order.

Here is the map where 1,488 refugees were placed between November 1 and December 1, 2019:


Below are the top sending countries (in parenthesis after each is the number of Muslims in the group).   Take note of the fact that we are only bringing in a tiny number of Middle Eastern Christians from Afghanistan, Iraq and Syria.

There is no Muslim ban.

DR Congo 509 (M: 17)  It is maddening when you consider that Obama said more than six years ago that we would limit our intake of DR Congolese to 50,000  and we are now at or near 60,000!

Burma 337 (M:37)

Moldova 94 (M: 0)

Afghanistan 91 (M:82)

Ukraine 78 (M: 0)

Iraq 50 (M: 35)

Syria 37 (M:32)  So much for saving the Syrian Christians!

Somalia 31 (M: 31)  Sixteen of these went to Minnesota over the last 4 weeks.


*** These are the nine federally funded contractors, all political Leftwing organizations, that at present are deciding where the UN-chosen refugees are being placed in America.


If you didn’t know, I have a category entitled, where to find information.  You might find it useful to follow some of my recent posts on the President’s Executive Order.


Handy Chart on Obama vs. Trump Refugee Admissions

I have a category here at RRW entitled ‘Where to find information’ and I am placing this short post there for your future reference.

I’ve become sick and tired of hearing, via uninformed media, that Obama admitted 100,000 refugees a year during his presidency.

He did not. 

According to the Refugee Processing Center:

In only one year did he set a CAP (CEILING) in excess of 100,000 and he set that in September 2016 during the waning months of his Presidency—either anticipating that Hillary was coming in to ‘welcome’ that many, or in the case of a Trump win, he was setting Trump up to look mean and unwelcoming.

Obama could have set a 100,000+ CAP in any of the previous years, why didn’t he?

Note also that Obama didn’t admit near his ceilings in several years of his time in office.

Whatever deception Obama (his State Department!) was trying to pull, please keep this chart handy because when the new numbers are recorded at the end of this month, that 2009 year will drop from the chart.

Note the ‘Ceiling’ column vs. the ‘to the US’ column which is the number that actually were admitted.


If you see a news report in a local paper about how Obama admitted 100,000 refugees a year, be sure to tell the reporter/editor to get their facts straight!