During Trump’s Presidency Many Refugee Agency Affiliates Closed

I don’t know exactly how many, but I have heard that around 100 offices closed.

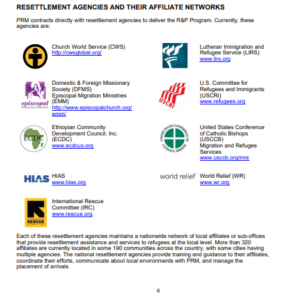
The nine contractors*** call them affiliates, but you could also call them subcontractors (I do).  I suspect they don’t like the later word because it then appears that there are lots of bucks moving around, and there are!

As the Obama Administration was ending we had reported that efforts were underway by the US State Department to add as many as 40 new locations for the placement of refugees since the contractors were wearing out their welcome as they overloaded towns and cities with poverty.
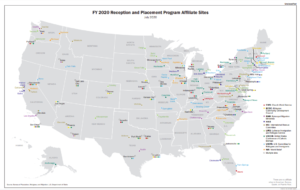
Here is a map from the Refugee Processing Center showing where refugees were being placed in 2016.  I know it is hard to read but you can see it enlarged either at the link above at RPC, or use the link under each map.

See that the nine contractors are color-coded and listed in the right hand corner, and note that more than one contractor can have local offices in cities especially eager for more diversity and for more needy people to care for.

We can only assume those cities have run out of their own poor people!

https://www.wrapsnet.org/documents/PRM-RPP+Affilaite+Sites+2016+-+LG.pdf


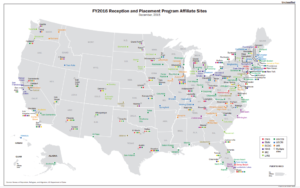
Now here is a map of the locations for refugee resettlement at the time Biden was installed in the White House.

https://www.wrapsnet.org/documents/2290-PRM-FY20-Affiliate-Sites-Large.pdf


You can expect to see a re-opening of some of those offices closed during the Trump years, and pay close attention to local efforts, often by those “Interfaith” political organizations, agitating for new offices.

Frankly, the only way forward now is to work at the local/state level for most of your political activity.

Americans Last!

***For New Readers these are the nine federal refugee contractors who worked to put Biden and Harris in the White House and are lobbying for millions of illegal aliens to be transformed into legal voting citizens, as well as raising the refugee admissions ceiling from 15,000 this year to 125,000.

They are largely paid by you, the taxpayer, for their work of changing America by changing the people, and in so doing, are putting Americans last!

This post is archived in my ‘Knowledge is Power’ category.

Joe Biden Plans to Admit the Most Refugees in any One Year Since 1992

Not even Saint Obama proposed such a huge number.

In the midst of a pandemic when large numbers of Americans are unemployed and struggling…

Joe Biden and Kamala Harris campaigned on lifting Trump’s so-called Muslim ban and immediately setting the ceiling to 125,000 refugees to be admitted in this fiscal year (FY21).

Trump had set the ceiling at 15,000 the lowest cap since the program began over four decades ago.

That 125,000 does NOT include those flowing toward our borders now in anticipation of Biden opening the borders and would be the highest cap in nearly 30 years.

(The 125,000 ceiling is only for those we fly into the US from the third world at taxpayers’ expense.)

Because we need to have facts, which are going to be harder to get as the Refugee Processing Center (US State Department contractor) has removed the very useful “Interactive Reporting” function we have have come to rely on for the last decade to understand who is being admitted and placed in your towns and cities, I will be posting information like this below when I can get it.  (To be archived in my Knowledge is Power category).

“Interactive reporting is no longer available”

This information (below) is available at the moment:

See that Biden has said he would admit tens of thousands more refugees than any predecessor (including Obama) for the previous nearly 30 years.

The number greater than 125,000 was 132,531 (1992), one of George HW Bush’s big refugee admission years!

The Refugee Act of 1980 was signed into law in the spring of 1980 by Jimmy Carter who of course later that year went on to lose the election to Ronald Reagan.  The vast majority of those early refugees were from Southeast Asia and they were escaping COMMUNISM.

Interesting that it was George W. Bush who really opened the flow from Africa.  And, it was Clinton who favored the flow from Russia.

President Trump admitted the least number of refugees in one year—11,814 in FY20.

Total refugees (again these are the refugees we flew into the US mostly at the behest of the United Nations)— 3,456,532—admitted over four decades.

Biden/Harris plan to put the US Refugee Admissions Program on steroids as they have promised the refugee resettlement contractors—the nine fake non-profits below.  Your tax dollars fund them to change America by changing the people.

Taxpayer Funded Refugee Resettlement Contractors Doing Well even with Trump in the White House

When President Trump arrived in the Oval Office I had a lot of hope that the new Administration would begin to turn off the funding for the nine federal resettlement agencies that have been for decades monopolizing all refugee placement in the US.

But, alas, even as refugee numbers have plummeted, the contractors are still sucking down millions of federal dollars each month, in most cases on par with what they were getting during the Obama years.

And, as they complain that they have had to close offices and fire staff they are still doing well (Ha! By doing good?) and will be well-positioned to ramp-up as soon as the Dems regain the White House (whenever that is!).

Presidential candidate Joe Biden has already signaled he wants over 100,000 refugees admitted each year (a figure Obama never achieved).

Of course, it isn’t all on Trump, Congress is a major player and there is no will there to slow or reform the refugee program. Oh, some do want to ‘reform’— by expanding it!

For the umpteenth time, the flawed structure of the UN/US Refugee Admissions Program has not been reformed one significant bit in the last 3 years.

What are these ‘charities’ doing with all this money?

Using data at USASpending.gov ,*** I’ve gathered in one place the federal payout to the nine federal refugee grantees/contractors which, as I said, have monopolized all refugee resettlement in America for decades.


When looking at the screenshots below, for relative comparison of the size of the ‘non-profits,’ that number in the left hand corner is useful. It is what they received in the last twelve months from the US Treasury—the US taxpayer.

Know that FY2008 was Bush’s last year and that FY2016 was Obama’s last year in office.

Church World Service


That $45 million is what they received in the last 12 months from you, involuntarily via the US Treasury.
2008 was a Bush year. And for FY2020 remember we are only 7 months into the fiscal year which ends on September 30th.


Ethiopian Community Development Council


Don’t ask me why they show no federal funding for those previous years, they have been around for a long time.


Episcopal Migration Ministries

(This one is tricky because they have another name!)


HIAS (aka Hebrew Immigrant Aid Society)


Notice that HIAS has had its best year in over a decade during the Trump Administration.


International Rescue Committee


There were additional transactions for the IRC under different duns numbers.
They are down a little under Trump, but they are up more than double what they were getting under Bush!


U.S. Committee for Refugees and Immigrants


Lutheran Immigration and Refugee Service


United States Conference of Catholic Bishops

(By the way, in addition to the monies here mostly for the refugee program, the Bishops received a whopping $400 million for Catholic Relief Services.)


The Bishops have taken a significant drop in funding since their top Obama year.


World Relief Corporation


So what are the contractors whining about, they are all still better off now than they were ten years ago.  And, they are positioned well to expand when the Dems retake the White House.

This post is filed in two categories:  Where to find information and Knowledge is Power.

*** USASpending.gov is a relatively new undertaking of the US government that creates transparency for all of us and it was created in the Obama Administration.

Over 1000 Afghan ‘Refugees’ Flown into US in Last Four Weeks

While you have been incarcerated at home, discouraged from traveling at all, the US government has flown 1,003 so-called Special Immigrant Visa holders into the US and distributed them around the country.

On March 16th, just as the regular refugee admissions program was about to be shut down (although it wasn’t completely suspended), I made note that we were at 6,867 special refugees from Afghanistan at that point for fiscal year 2020.

As of April 13th we are at 7,870, a gain of 1,003 in that 4 week period!

Knowledge is Power VIII.

Where do I find these numbers (for readers who think I make this up!)?

Go to the Refugee Processing Center by clicking here.  This screen appears. Click on the link I have designated with an arrow and a spread sheet opens up and you can see the numbers I am talking about.  You can also see which states ‘welcomed’ them!

I’ve filed this as a Knowledge is Power post. See my whole series here.

To learn more about Special Immigrant Visas see previous posts.  

I’ve written a few posts at ‘Frauds and Crooks’ about SIVs as well, see here.

Knowledge is Power VII: ORR Annual Reports to Congress are Valuable Resources

Editor:  This is the seventh in my ‘Knowledge is Power’ series. Although there is a lot of knowledge provided here daily my goal with this series is to supply readers with sources of information so that (LOL!) I don’t have to continually answer basic questions and you can get to work where you live to help educate your friends, neighbors, elected officials and the media about the expensive, dysfunctional program that is changing America by changing the people!

Stop reading here if you don’t want to know more!  If you do, then read this post, check out the 2017 annual report and go to the category specifically set up to archive this series of posts for more information—Knowledge is Power.

https://www.acf.hhs.gov/sites/default/files/orr/arc_fy2017_1_31_2020_508.pdf

The Refugee Act of 1980 requires the HHS Office of Refugee Resettlement to submit an annual report to Congress within three months of the close of the previous fiscal year (fiscal years close on September 30 of the previous year), but they perennially seem incapable of producing the document on time and often don’t publish one for years.

The Trump ORR hasn’t gotten it done on time either!

Well hallelujah, the 2017 report came out just about a week ago. 

If they followed the law we should be seeing the 2019 report by now.  By the way, I once did an analysis of those reports and when they were submitted and learned that during the Reagan and George HW Bush administrations the ORR followed the law, but when Clinton came in and Lavinia Limon (see post yesterday) became the head of the office they went off track and have never been on time since.

In FY17 the Office of Refugee Resettlement’s funding was $1.6 BILLION! 

And no where in the report did I find the cost of the US State Department’s share of the budgetary burden or the Dept. of Homeland Security share (it could be there, it usually is reported in the annual reports, but I didn’t see it).

Page 4. By the way, appropriations are made by Congress and usually dumped into big appropriations bills making it virtually impossible for a President to veto the funds for specific programs.


Again, I haven’t analyzed it carefully yet, but did have a look at the pages on welfare use and as usual it’s an eye-opener.

Of those who willingly reported in a survey for FY16 (page 20) here are some examples:

35% were on some form of cash assistance

14% TANF

16%  SSI (Supplemental Security Income, Social Security)

67% Food Stamps

24% Housing Assistance

Go to the report to see how much federal boodle the contractors get for myriad projects.

See a list of all of the annual reports.

I found them all useful when I wanted to find out how many Somalis we admitted since the program began, because, as you know if you have been using the Refugee Processing Center data (Knowledge is Power IV), that data only extends back to 2002.  Before 2002 you can do the laborious work of looking at the data provided on admissions in each annual report before 2002.

See that 2008 post about Somali numbers since the Refugee Admissions Program began. I used annual reports to find the numbers for much of it.  I was updating for awhile and I guess I better not be lazy and add 2017, 2018, and 2019 one of these days!

Again, today’s post is archived in a category set up for only this series of posts I call—Knowledge is Power.